The US Industrial economy again continued to gradually ease last week (if pipeline scheduling is correct), while consumer spending edged off of it's prior-week surge.
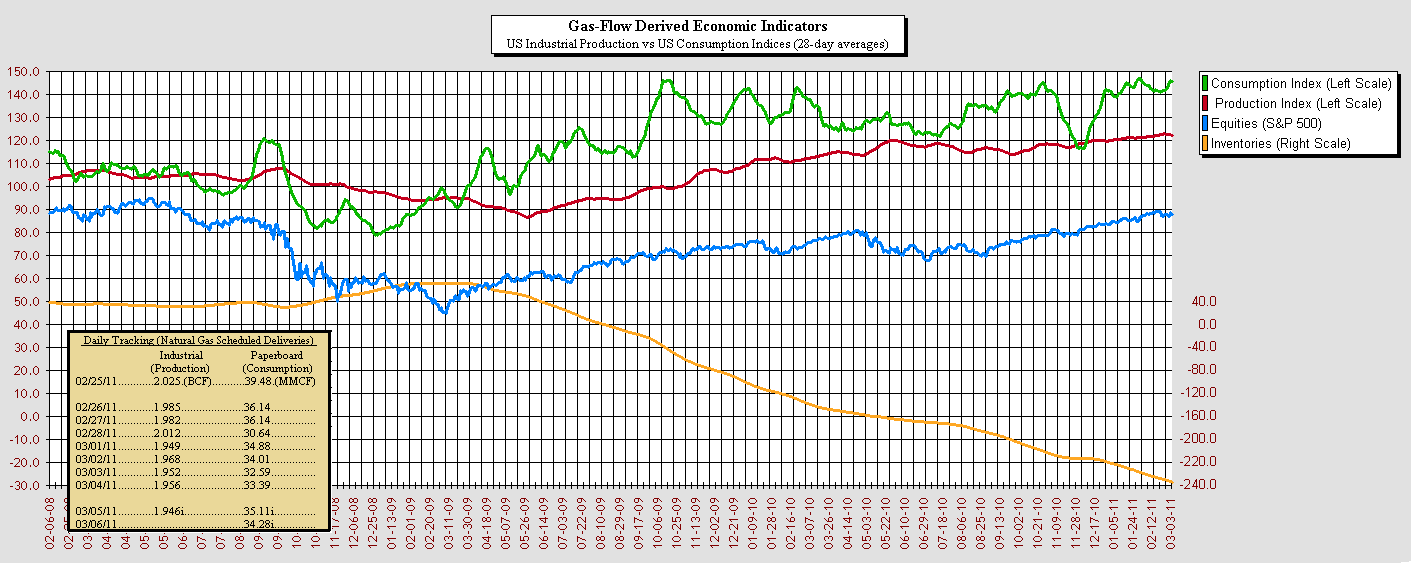
The Production Index (In terms of its 28-day moving average of gas-flow scheduling into US industrial facilities) slipped for it's fourth week in a row, easing to 120.3 (vs last weeks 121.2). In its dailies (raw, non-seasonally adjusted flows) the week was choppy, starting soft and ending with a flattish look.
The Consumption Index also declined (breaking it's string of four up-weeks in a row), gaining to 148.1 (from last weeks 150.6). In its dailies the week started strong in its raw (non-seasonally adjusted) numbers then softened mid-week.
The Inventories measure (the cumulative weekly difference between the Production Index and the Consumption Index) again continued in its long-term decline.
Overall, the recovery (despite the weeks declines) continues to appear strongly supported by elevated consumer-spending, an uncharacteristically-large lead in the Consumption Index over the Production Index, and continuing declines in the Inventories measure.
First-quarter results (due out starting in about 3 weeks) look to be exceptionally strong, as large gaps (in the past) of consumption over production have generally been consistent (in the modeling) with large jumps in profitability. And that gap is widening near the end of the quarter... probably to add to optimism as CEO's prepare their comments toward the 2nd quarter.
One possible good sign in the gas flows over the weekend - a large plunge in the gas-flows for the food-group (See the "Part-8" postings on the Investor-Village CWEI site) , which has been fearfully-robust virtually the whole winter (The food group has served as a contra-indicator in the past, probably because that junk-food-laden sampling picks up on America's habit of comforting its nervousness by heading for the fridge).
I took the news as quite economically-positive late last week... perhaps that food-group (if its premature weekend scheduling numbers hold up) is early confirmation... we shall see in coming weeks.
This upcoming week is both an end-of-month week and an end-of-quarter week. Industrial gas-flow numbers can sometimes change rapidly at such times (up or down), and with the gas-flow implied strength in consumption, a pickup in industrial activity once past quarters-end would not be (historically) unexpected.
Of course, with the slow-slide in the past few weeks on the industrial-side, an unexpectedly-bad unemployment report would also not be unexpected, so this game of watching and waiting goes on...
ROBRY DATA On ENERCAST
(http://www.firstenercastfinancial.com/energy/)
 As a reminder, Enercast Financial now hosts several web pages on their site for viewing and downloading the data I post, and I would want to encourage it's use (Enercast now offers the most comprehensive, accurate, and up-to-date site for the data I post... and has become the preferred site on the natural-gas side of the data).
(First Enercast also shares my appreciation for the public domain, so the Robry825 data downloads will continue to be free of cost and free of restrictions... and can be shared with friends, reposted, published (etc) at your discretion... for the better of all).
 Also linked through the Enercast site is the new "Robry-Calc" spreadsheet application (another project that I have become both deeply involved with the past couple of years and have mentioned previously), which I hope will serve to be of value for many as well. In many ways I believe "Robry-calc" to be revolutionary, and it is at it's foundation what I rely upon for the number-crunching I do daily. It is (by its nature) simple enough that the kids can easily use it to check their homework at night, and at the same time complex and powerful enough to be able to open up to process millions (or even billions) of cells of data in seconds.
-Robry825